Sea Level Rise, Wellington New Zealand
The projection for sea-level rise in New Zealand is expected to reach up to 10% more than the global average (IPCC, 2013). However, there is a significant amount of uncertainty in future sea-level rise and unattributable likelihoods for each prospective scenario. What is certain is that sea levels will continue to rise in the 21st century, and at an unprecedent rate relative to the past several thousand years. While these projections may not appear large from a geo-historical perspective, the impacts of minor fluctuations in sea-level rise have the potential to cause profoundly serious and even debilitating side effects, particularly for coastal settlements.
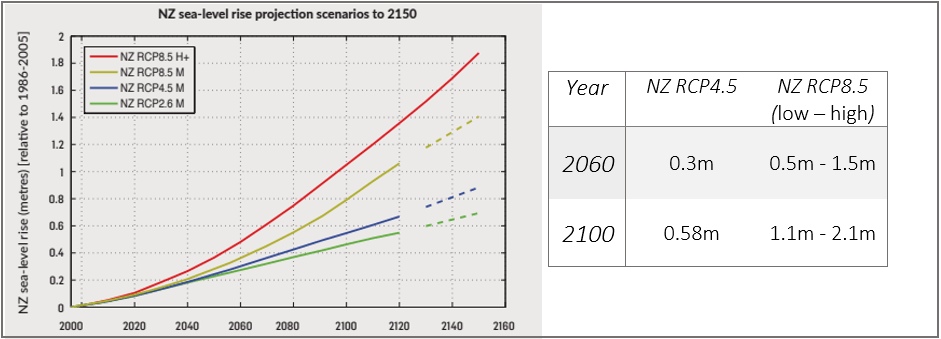
Much of human civilization was built with consideration for historically observed sea-levels, which saw some variation due to the Earth’s natural warming and cooling cycles. Hence, many of our collective infrastructures and societies were erected under the pretense of relatively minor fluctuations in sea-level, and certainly its continued predictability. Unfortunately, this means that we now face a heightened sensitivity to deviations from our normal expectations. Furthermore, because societies are complex and multi-faceted, we understand that such disruptions will result in harm to other existing systems, as well. Figures from the Ministry for the Environment indicate that by the year 2060 there will be dramatic increases to sea-level rise, affecting many areas of New Zealand. Conservative figures estimate between 0.3m-0.5m of rise, and just 40 years later between 0.58m-1.1m; though this band is scientifically contested to be as high as 1.1m-2.1m by the year 2100 under RCP8.5 [Figure 1].
The impact of this quantity of sea-level rise will be pronounced throughout the greater Wellington region. We will use Petone, one of the most affected regions, as one such example [Figure 2, Figure 3].


Simulations depicted in Figure 2 and Figure 3 greatly concern the coastal risk exposures for land elevations less than 1.5m above mean high water spring (MHWS), as determined by the Ministry for the Environment (MFE). This includes: 5,483 places of residence, a population of 11,399 individuals, and 4km of rail (MFE, 2017). These totals are for the entire Wellington region, to which Petone substantially contributes, and does not account for any rise exceeding 1.5m of elevation. Therefore, if the worst case scenario were realized (2.1m at RCP8.5 by 2100) there would be many more affected people and structures unaccounted for by these projections.
The effects of sea-level rise are not evenly distributed geographically or socioeconomically. Effects correlate to land elevation, where (typically) the lower the elevation, the greater the impact. The evacuation of people in heavily affected regions, such as subsections of Petone, would be inevitable under worst case conditions. This would debilitate local economies and trade, resulting in the inland migration of local businesses. Additionally, not everyone in these subsections will be able to afford relocation, nor will some of these individuals want to move. A New Zealand government faced with the task of forcing the relocation of its citizens will need to ensure its follow-through is thoughtful and culturally considered.

Figure 4 is a map identifying several national historic landmarks for the Petone region (Heritage NZ, 2020). Among these markers are the Petone Settlers Museum, St Augustine’s Church, Lower Hutt Central Fire Station, and more. The loss of essential services (e.g., fire stations) has plainly negative implications for all residents in the surrounding areas. However, it is also important to consider that as tangata whenua, Māori place importance on all land in Aotearoa. This means that the loss of land and wāhi tapu [Figure 4] weighs disproportionately on Māori individuals and communities, as well as individuals that are from poorer socioeconomic backgrounds. Another point of contention (though it is too large of a topic to be discussed here) is that; any vulnerable populations will no doubt have their struggles further exacerbated by worsening environmental pressures.
Another vital consideration in future risk/vulnerability assessments are climate refugees: people who will be forced to seek refuge in neighboring countries due to climate change and natural disasters. This is especially pertinent to New Zealand as a neighbor to many Pacific islands, which are among the earliest and [currently] most affected by climate change.
In practice, it is difficult to account for the disparity between sea-level rise projections for RCP4.5, versus RCP8.5. With a representative concentration pathway (RCP)1 closer to 4.5, there would be minimal needed adaptations. That is to say; while significant changes to our current infrastructure are required to attain RCP4.5, the impact of sea-level rise resulting from this trajectory is comparatively small [Figure 2, Figure 3]. Based on these models, the Greater Wellington Regional Council (GWRC) can handle 0.3m of sea-level rise by 2060 without taking drastic measures. This would likely include the accommodation of sea-level with higher floor levels and/or the protection of vulnerable areas with tidal barriers. However, RCP8.5 would pose a much greater threat to the Wellington region [as well as all New Zealand], and require a much more elaborate response, such as widespread accommodation, protection, and retreat ().
Two practices which will be crucial to facing the coming challenges are: (1) hazard, risk, and vulnerability assessment and (2) dynamic adaptive policy pathways. This means that we must prepare existing infrastructure for moderate sea-level rise and respond in an agile way if we observe a more dire trajectory takin place. We must also prepare policies that are reactive [dynamic] (MFE, 2017) and can adapt to circumstantial changes, thus minimizing damages caused by a policy lag.2
The Ministry for the Environment’s publication Preparing for coastal change: A summary of coastal hazards and climate change guidance for local government goes into much greater detail on recommendations around the iterative, 10-step decision cycle and how to meaningfully implement adaptive policy pathways.
